App · mushrooms
Where is the nearest good mushroom forest
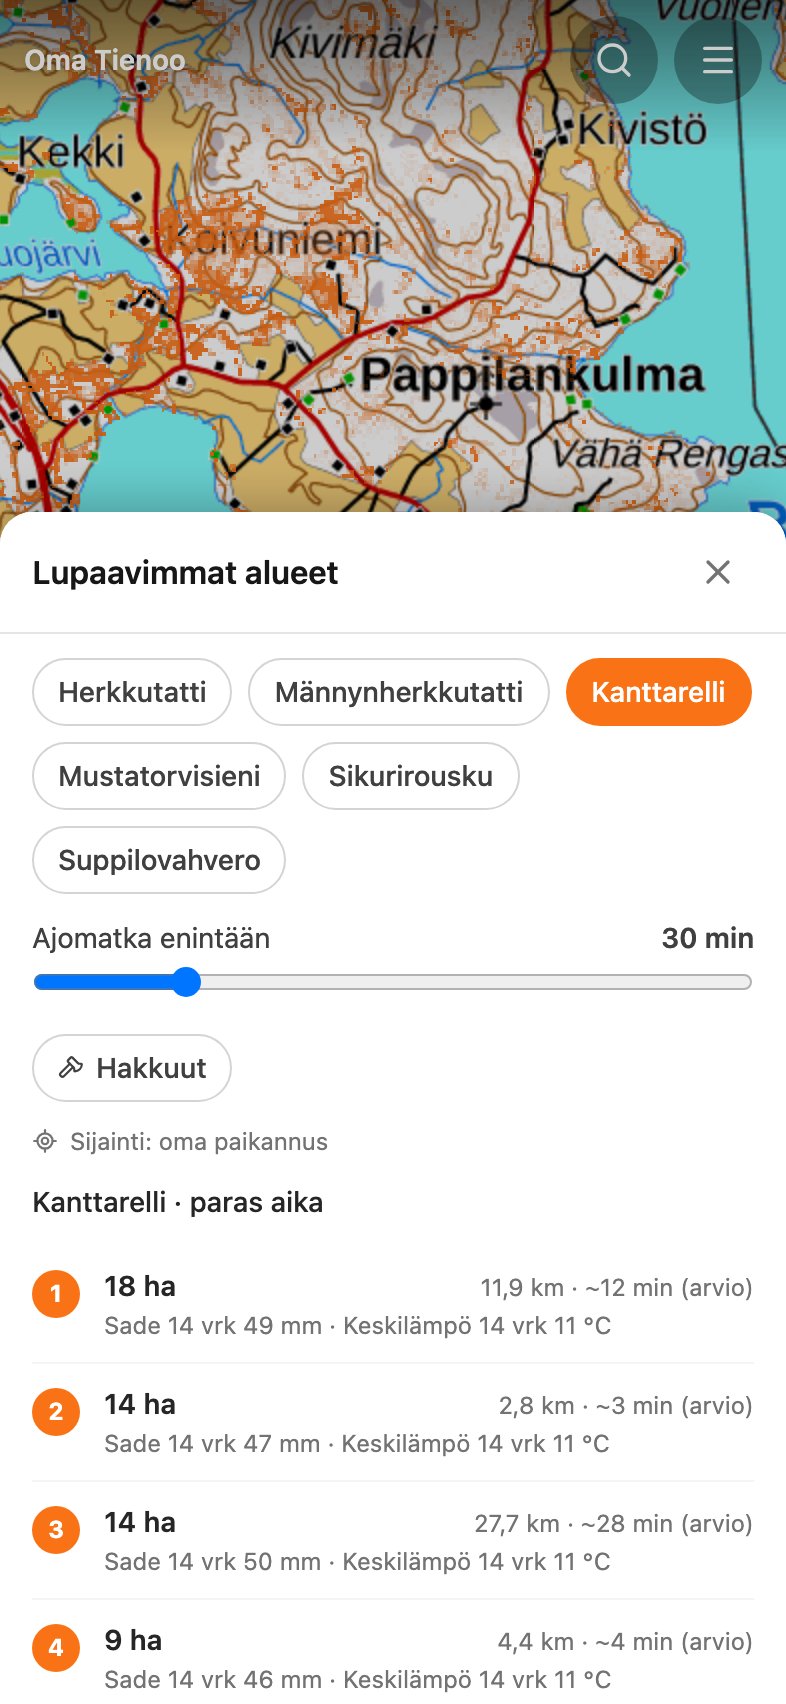
Choose a species and the longest drive you want, 15 to 90 minutes. Most promising areas lists the ten best areas within that time from your own position or the map centre.
The order weighs three things: the size of the area, how good a habitat it is for the species, and how far along the season is there right now. A large but poor area can end up lower on the list than a small but good one.
What a row shows
Every row shows the area's size in hectares, the distance and an estimated drive time, rain over the last two weeks and the mean temperature at the area. Below that a row may read dry, cold or frost when one of those applies to that area.
The drive time is an estimate. It is calculated as a straight line at 60 km/h, so it is shorter than the real route. The gap grows where a lake lies in the way.
Tap a row
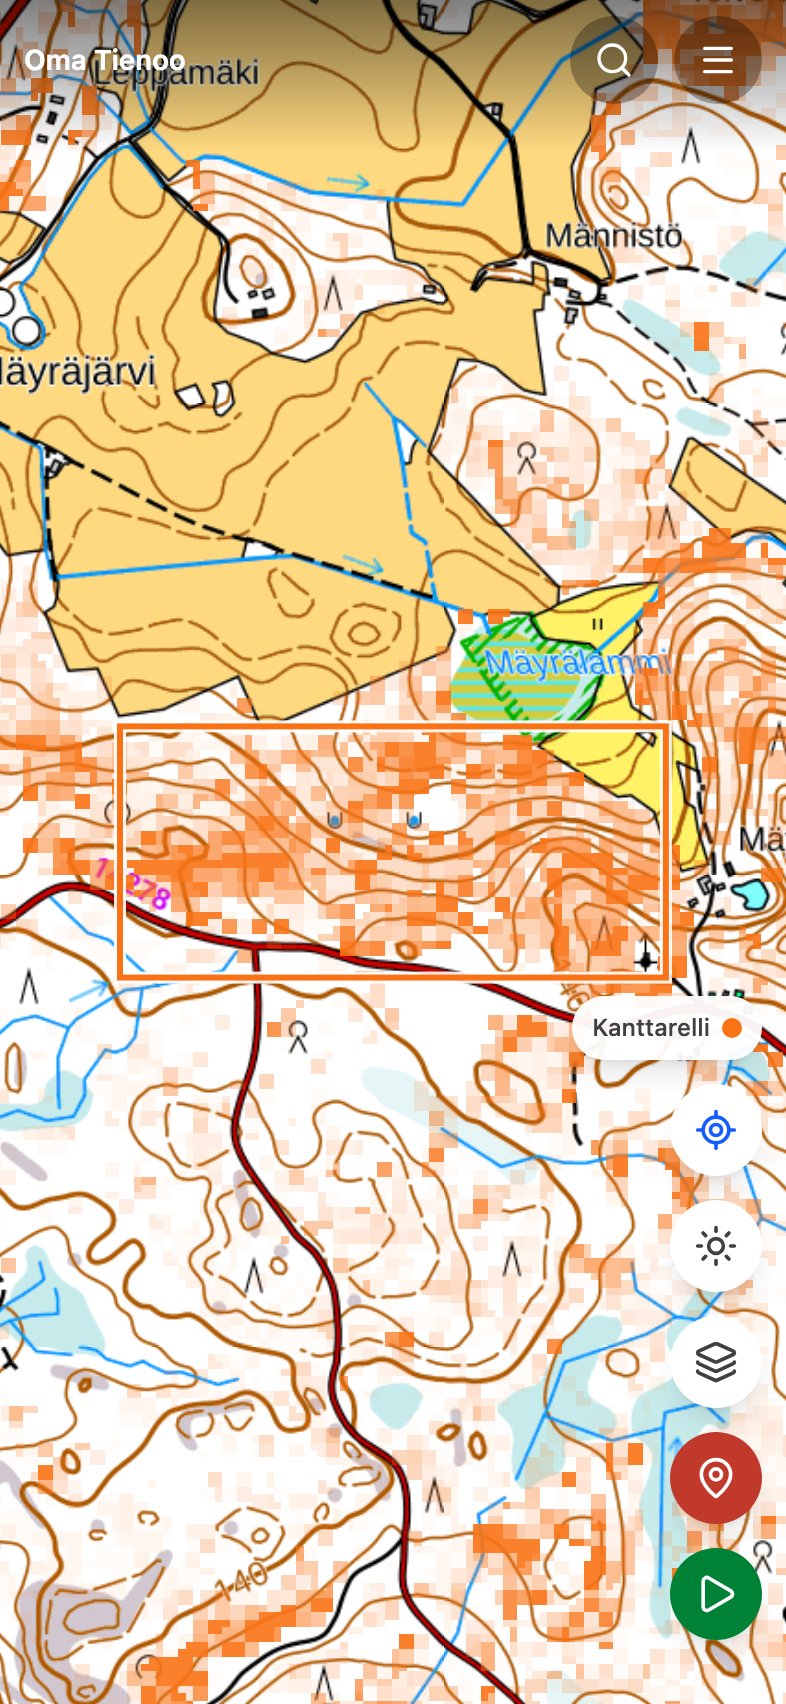
Tapping a row moves the map to the area and draws its boundary in the species colour. The species' own map layer turns on too, if it was not on already.
Felling declarations are subtracted
The mushroom map is built from Luke's forest data from 2023. That data still shows as forest whatever has been felled since. That is why each area has hectares subtracted where a metsänkäyttöilmoitus (forest use declaration) has been filed since June 2020 for a felling that removes the stand. A thinning is not subtracted, because it leaves the forest standing.
A row shows both numbers: "30 / 40 ha" means 30 of the area's 40 hectares remain, and below it the row states how many hectares are declared. A declaration is a plan. It does not say whether the felling has happened yet.
Your position stays on the phone
Your own position, or the map centre when there is no fix, is used on the phone to find the areas. It never reaches the network and is never logged. Only the chosen species is sent.
Where the data comes from
- Habitat
- Luke's multi-source national forest inventory map (MVMI 2023)
- Felling declarations
- The Finnish Forest Centre's open forest data, declarations from June 2020 onward
- Weather
- Finnish Meteorological Institute observations, the same data as the season weighting
- Drive time
- A straight-line estimate at 60 km/h
What it is not
- Not an observed mushroom. An area is the model's prediction of habitat. MVMI's site-type class is correct for about 55 percent of pixels, so some areas are in the wrong place.
- Not an exact drive time. The figure is a straight-line estimate. A route calculated across a lake may in reality go around it.
- Not every felling. Felling for a household's own use and tending of small trees need no declaration, so they are not subtracted from an area.
- Not precise weather for one spot. Rain is calculated from a grid about 55 km across, because that is how far apart the rain gauges are. The figure describes the area, not one particular slope.
How to use it
Menu → Most promising areas opens a species picker and a drive-time slider, and the list updates right away. Fellings says more about the declarations, and the mushroom maps say where the prediction itself comes from.