Map layer · mushrooms
When it is worth going
A mushroom map says where a species does well. It does not change with the seasons, because the forest does not either: the same spruce stand is as good chanterelle ground in November as in August, even though you will find nothing there in November. The season weighting is that missing half.
Two options
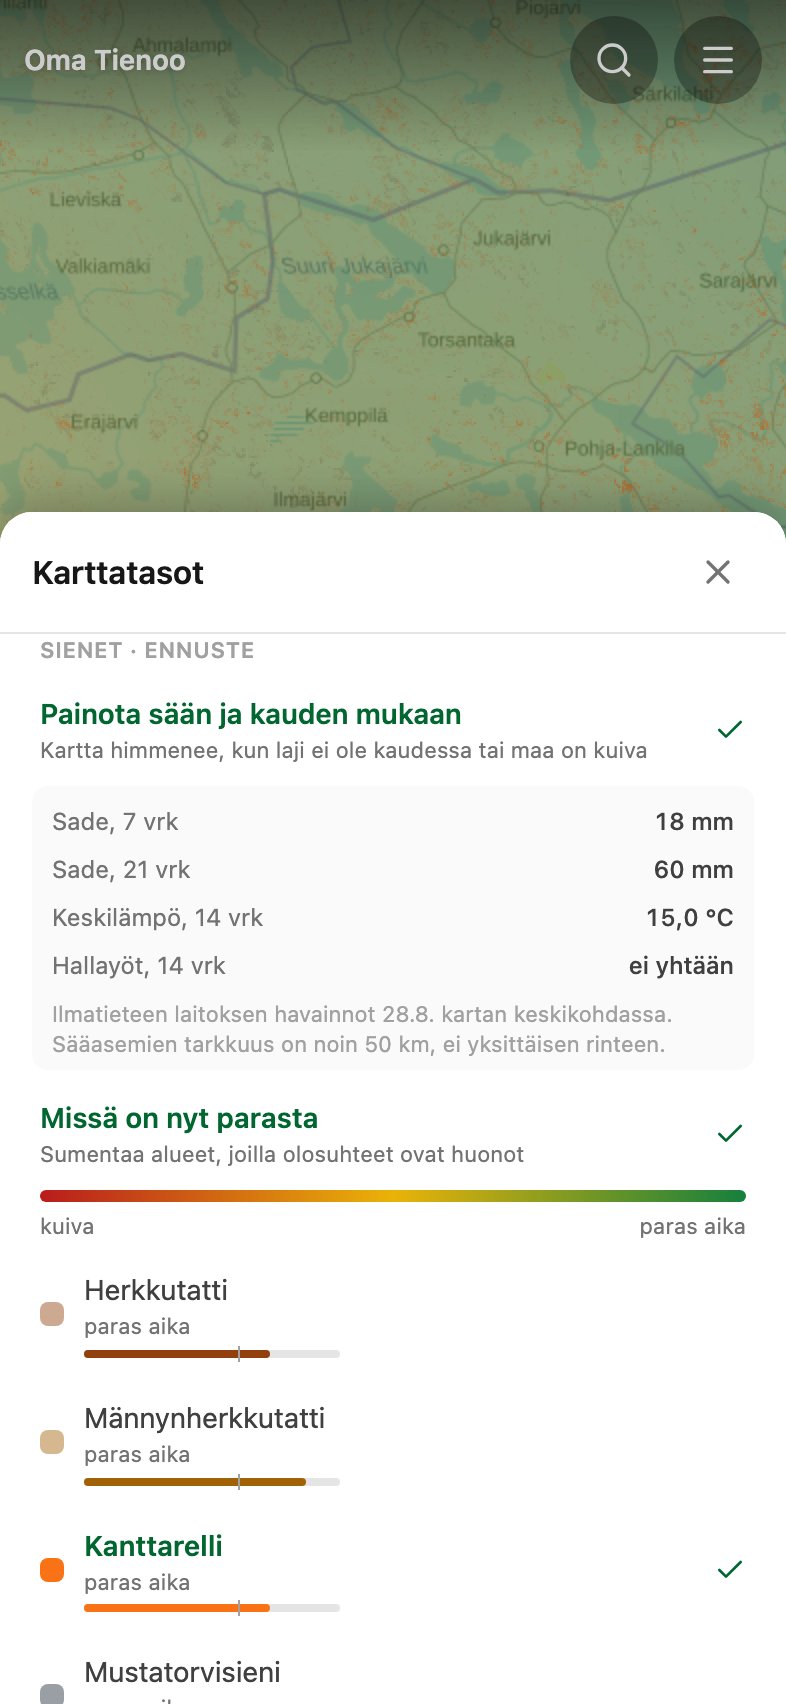
Painota sään ja kauden mukaan (weight by weather and season) leaves a species layer at full colour where the trip is worth making, and fades it where the species is out of season or the ground is too dry. Several layers on at once compare directly: in August the chanterelle is at full orange with the funnel chanterelle faded beside it, which answers what is worth looking for right now.
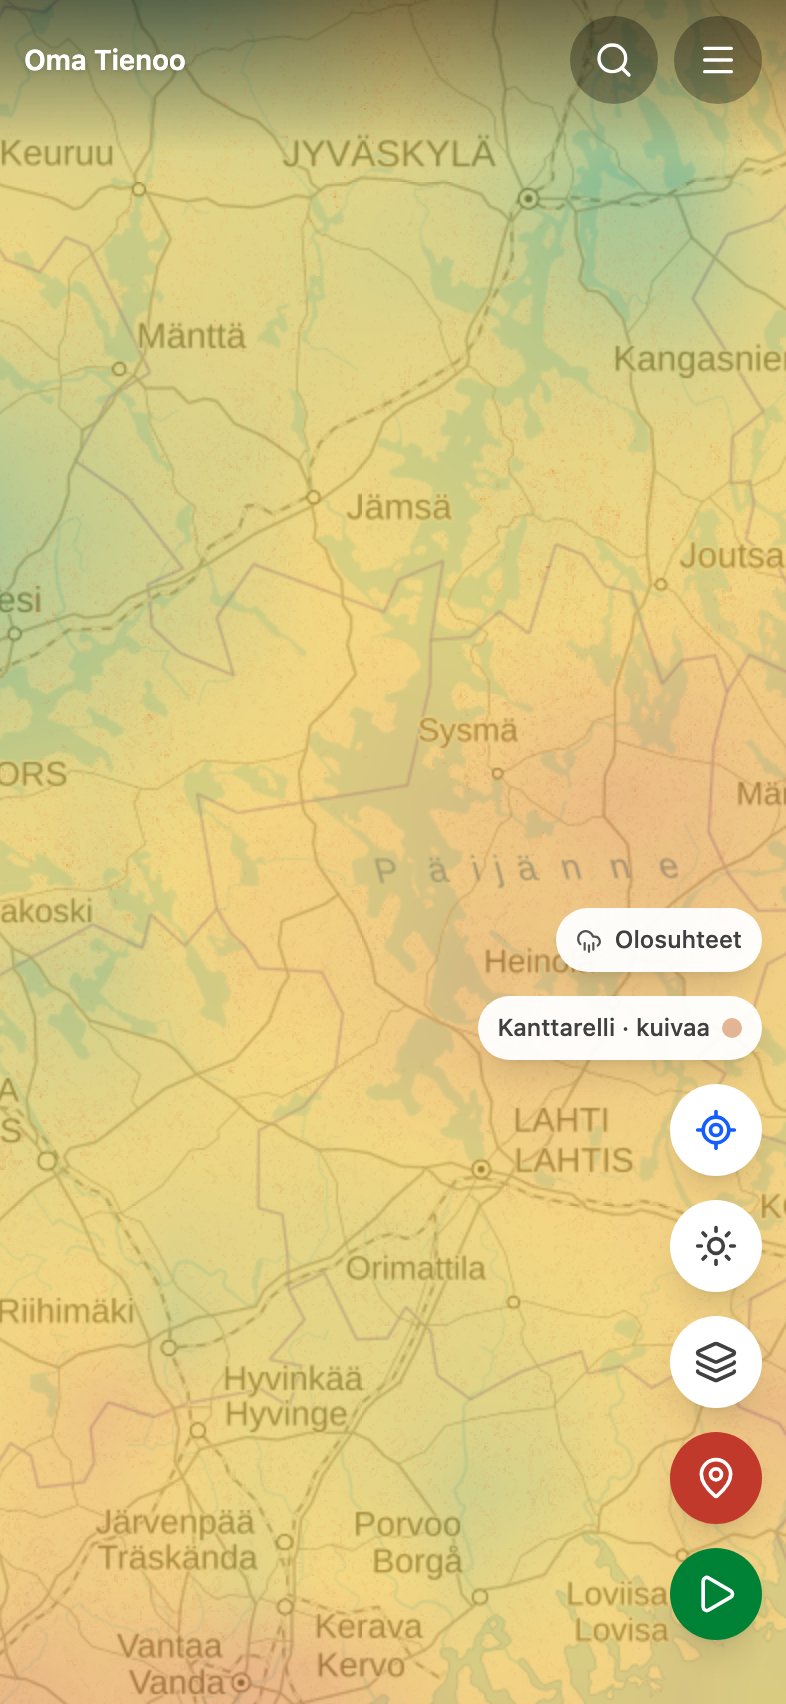
Missä on nyt parasta (where it is best right now) colours the whole map from red to green, so you see the direction at a glance without scrolling the map back and forth. It is meant for zoomed-out use: the layer is drawn on a ten kilometre grid, so zoomed in close the whole screen is one colour.
What the app says, and why
Each species carries a word for where things stand: ei vielä (not yet), alkamassa (starting), paras aika (the best time), loppumassa (ending) and ohi (over) come from the calendar, while kuivaa (dry) says the season is open but the rain has not come. There are six words for three states because "not yet" in November and "ending" in a dry August are both simply wrong.
Beside the word is a meter showing how far from good it is, with a mark where paras aika begins. One word cannot separate barely dry from bone dry, and that difference decides whether you go today or wait for rain.
Where the numbers come from
Finnish Meteorological Institute observations, every night. Rain over one week and over three, the mean temperature over a fortnight, and the frost nights. Rain works with a per-species lag: chanterelles come up roughly a fortnight after a proper rain, funnel chanterelles later and in colder weather. So last week's downpour does not show as green yet, and one from a fortnight ago does.
Rain is measured by rain gauges, of which there are about 170 in the whole country, so roughly one every 50 kilometres. The map is drawn on a ten kilometre grid, but its real resolution is that spacing: the numbers describe an area, not a single slope or hollow. Temperature and frost are measured more densely, at about 190 stations.
What it is not
- No yield prediction. The colour still means terrain, dimmed by the calendar and the rain. It does not claim there are mushrooms on the ground right now.
- No observation data. The weighting is computed from weather alone. An index built from users' finds would be a map of where people find mushrooms, and this service does not produce one, however much the numbers were added up first.
- Estimated, not fitted. The lags and rainfall thresholds are rules of thumb, not fitted to observations. They sharpen only once there is a season of finds behind them.
Turning it on
Both options are in the Karttatasot sheet under Sienet, and both are off by default. Switched off, the map is exactly what it was. With no network the weighting falls back to the calendar alone, which needs no connection at all. Mushroom maps explains how the prediction itself is calculated.