Map layer · conditions
Where it's best right now
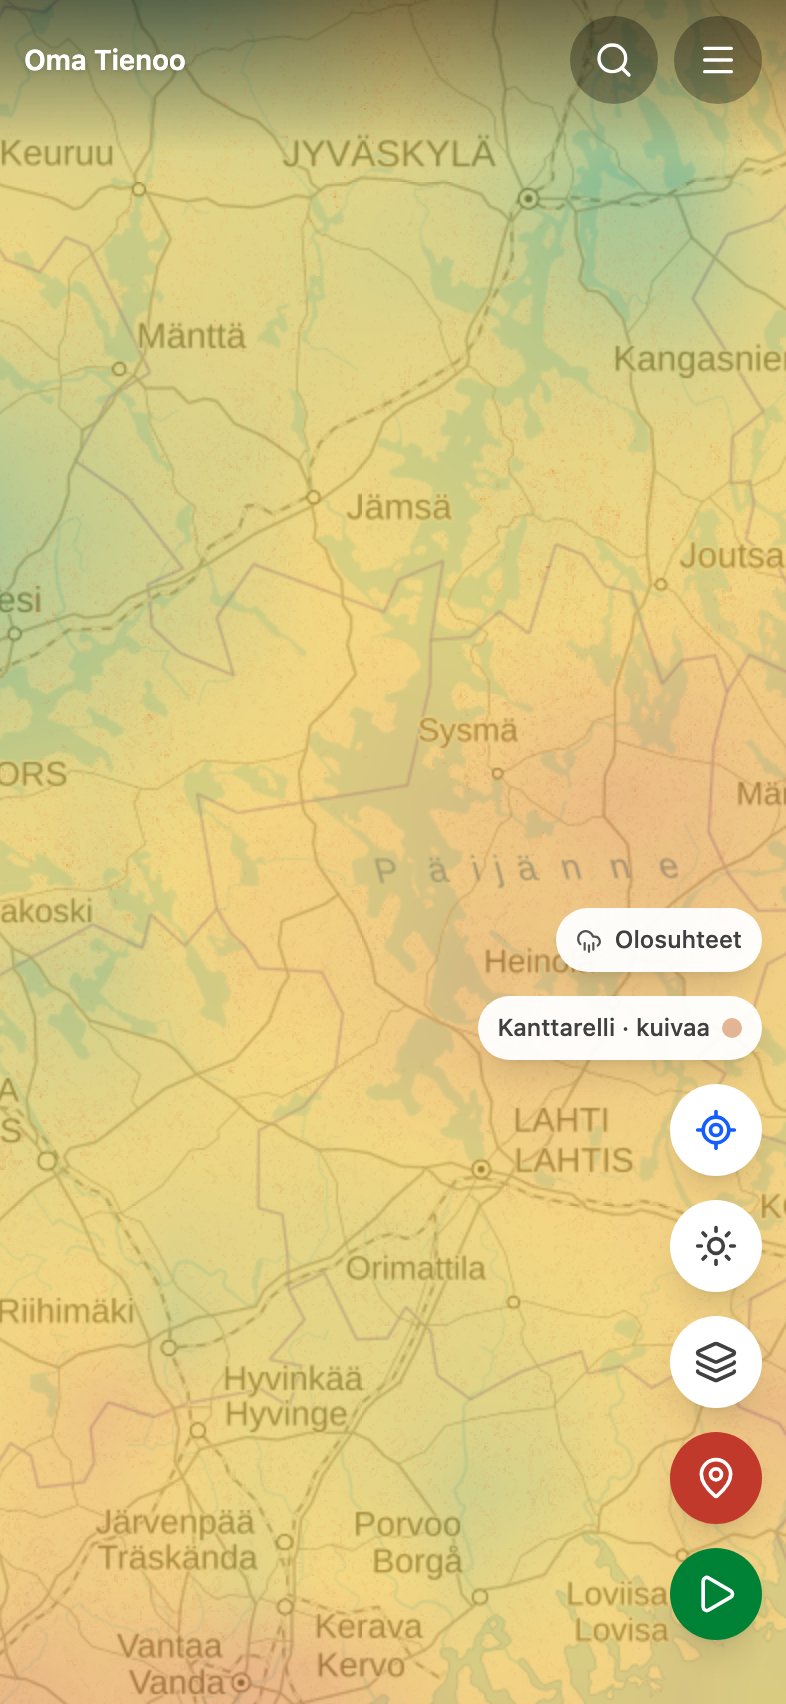
A species layer says where the species does well, and season weighting dims it where the species is out of season or the ground is dry. The conditions layer is the same information in a third form: the whole map coloured from red to green, so one glance gives you the direction without panning back and forth.
Why it is a wide-view layer
The layer is drawn on a 10 km grid, so zoomed in the whole screen is one colour. It is for the question you settle before leaving: which way to drive. The Conditions button at the edge of the map says when the map is too close for the colour to mean anything.
What it needs
One species selected, because "how good is it here" means nothing until you say good for what. And the night's weather data: without it the row is disabled and the map stays as it was. The switch is in the Karttatasot sheet in the mushroom group, with the colour scale under it, so red and green never have to be guessed.
Where the numbers come from
The same nightly build as the season weighting: Finnish Meteorological Institute observations, rain over one week and three weeks, the two-week mean temperature and frost nights, with a per-species lag. The gauges are about 50 km apart, so the numbers describe an area and not one hollow. What the numbers are and what they do not promise: season weighting.
What it is not
- Not a yield forecast. Green means the conditions in that area are right. It does not say there are mushrooms on the ground.
- Not observation data. The colour is calculated from weather alone. Nobody has been to look.
- Not forest data. A cell is ten kilometres across, so it holds both the species' best ground and open field. The ground is what the species layer says, and the two layers together are the whole answer.
The other layers
Every layer and the question it answers: the map and its layers.